Tansley Review - New Phytologist 171: 501-523 (2006)
|
Seed dormancy and the control of germination
|
William E. Finch-Savage (1), Gerhard Leubner-Metzger (2)
|
(1) Warwick HRI, Warwick University, Wellesbourne, Warwick CV35 9EF, United Kingdom, Web: 'Seed Science Group' http://www2.warwick.ac.uk/fac/sci/hri2/research/seedscience/
(2) Institut für Biologie II (Botanik/Pflanzenphysiologie), Albert-Ludwigs-Universität Freiburg,
Schänzlestr. 1, D-79104 Freiburg i. Br., Germany, Web: 'The Seed Biology Place' http://www.seedbiology.de
Received February 23, 2006; accepted March 27, 2006; published
|

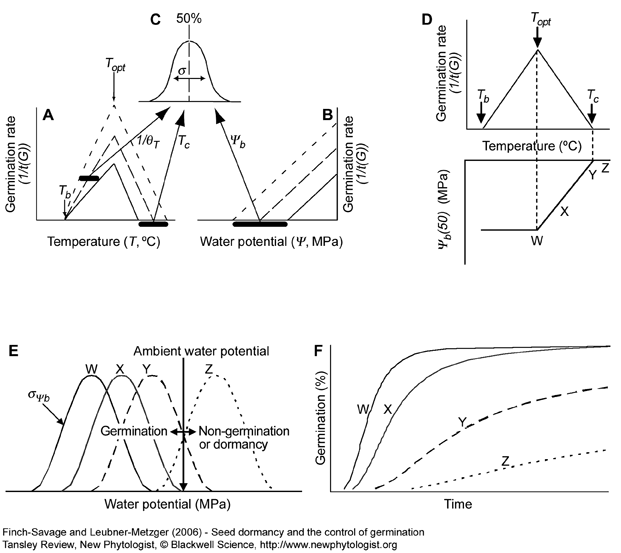
Figure 7. Schematic illustration of the effects of temperature (A) and water potential (B) on germination rate. G10 (dotted lines), G50 (dashed lines) and G90 (solid lines) represent individual seeds in the population at percentiles 10, 50 and 90 respectively. Germination rate increases linearly with temperature above a base (Tb). The slopes of these lines are the reciprocal of the thermal times to germination (1/ ). As temperature increases above an optimum (Topt), rate of germination decreases to a ceiling temperature (Tc). Rate of germination also decreases linearly with water potential ( ). As temperature increases above an optimum (Topt), rate of germination decreases to a ceiling temperature (Tc). Rate of germination also decreases linearly with water potential ( ) to a base ( ) to a base ( ). Tb is often the same for all seeds in the population, but 1/ ). Tb is often the same for all seeds in the population, but 1/ , Tc and , Tc and  vary between seeds in a normal distribution (C, vary between seeds in a normal distribution (C,  ). (D) Schematic representation of the relationship between the water potential of the fiftieth percentile ( ). (D) Schematic representation of the relationship between the water potential of the fiftieth percentile (  (50)) and temperature and their effect on the germination rate of percentile G(50). Figures A-D are modified from (Finch-Savage, 2004) and printed with permission from The Haworth Press, Inc., Binghamton, NY, USA; article copies available from The Haworth Document Delivery Service: 1-800-HAWORTH, E-mail address: docdelivery@haworthpress.com. (E, F) An illustration of the effect of (50)) and temperature and their effect on the germination rate of percentile G(50). Figures A-D are modified from (Finch-Savage, 2004) and printed with permission from The Haworth Press, Inc., Binghamton, NY, USA; article copies available from The Haworth Document Delivery Service: 1-800-HAWORTH, E-mail address: docdelivery@haworthpress.com. (E, F) An illustration of the effect of  values changing at higher temperatures on cumulative germination. Each seed in the distribution will respond by the extent to which ambient conditions exceed their individual threshold sensitivity (Alvarado and Bradford, 2002). The black line (W) shows values changing at higher temperatures on cumulative germination. Each seed in the distribution will respond by the extent to which ambient conditions exceed their individual threshold sensitivity (Alvarado and Bradford, 2002). The black line (W) shows  of a non-dormant seed population at optimum temperature (E) with rapid germination of all seeds (F). As temperature increases above optimum the distribution (W) shifts to the right (grey line; X) and seeds germinate more slowly. Further increases in the temperature (dashed; Y then dotted lines; Z), further reduce germination rate and the percentage of seeds that can germinate is also progressively reduced as of a non-dormant seed population at optimum temperature (E) with rapid germination of all seeds (F). As temperature increases above optimum the distribution (W) shifts to the right (grey line; X) and seeds germinate more slowly. Further increases in the temperature (dashed; Y then dotted lines; Z), further reduce germination rate and the percentage of seeds that can germinate is also progressively reduced as  exceeds ambient water potential. These seeds at high temperature are not dormant, but limited by their environment. However, the same illustration shows how other environmental conditions can also increase and decrease sensitivity (shift the distribution of exceeds ambient water potential. These seeds at high temperature are not dormant, but limited by their environment. However, the same illustration shows how other environmental conditions can also increase and decrease sensitivity (shift the distribution of  ) in the same way to induce or break dormancy (movement to the right or left respectively). ) in the same way to induce or break dormancy (movement to the right or left respectively).  values greater than 0 MPa cannot be measured, but are an extrapolation based upon those seeds that can germinate (Bradford, 1996). values greater than 0 MPa cannot be measured, but are an extrapolation based upon those seeds that can germinate (Bradford, 1996).
|
| |

|
|
Webdesign Gerhard Leubner 2000
Best viewed with browser version 4 and 800x600 pixel
This page was last updated on
15 July, 2006
|
|
