Molecular and General Genetics 256: 661-673
(1997)
Transcripts at the mating type locus of Cochliobolus heterostrophus
 |
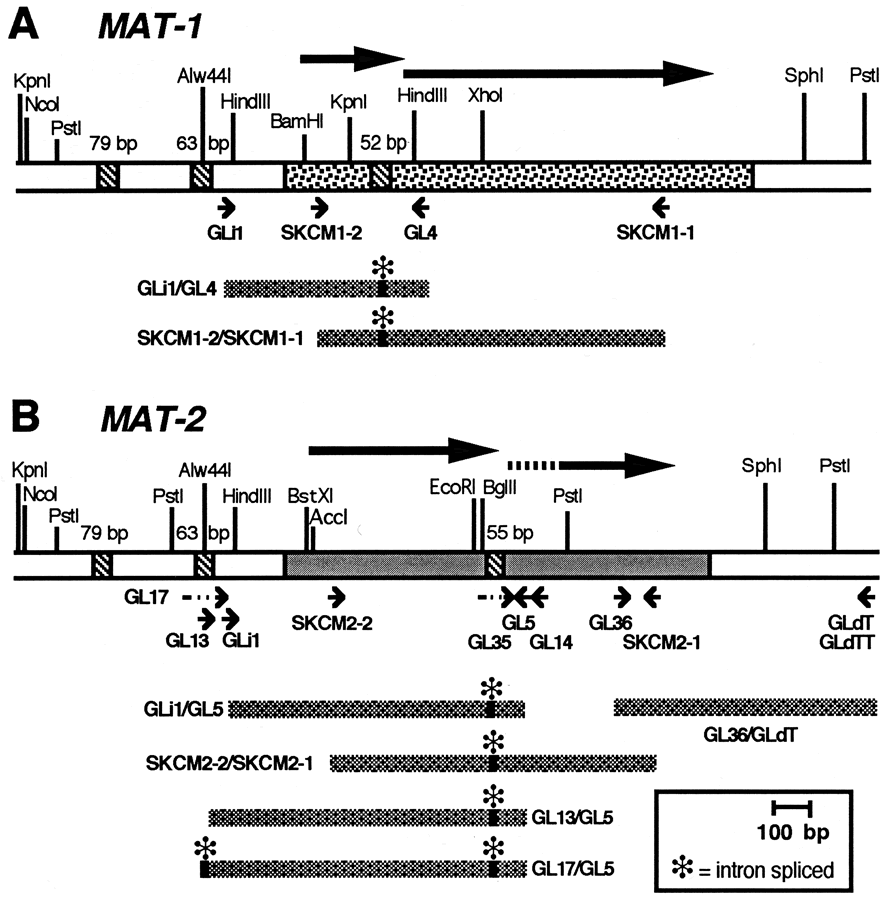
Fig. 5A, B R Amplification of partial MAT-1 (A) and MAT-2 (B) cDNAs. The maps at the top of each panel represent the MAT loci. Cross-hatched boxes indicate introns; from left, 79-bp, 63-bp and 52- bp (MAT-1) or 55-bp (MAT-2). The bars below represent partial cDNAs with introns (asterisks) spliced out, as determined by sequencing. Large arrows indicate ORFs previously proposed to be joined via intron splicing (Turgeon et al. 1993). Single-strand cDNAs, synthesized with primers SKCM1-1 (MAT-1) or SKCM2-1 (MAT-2) or GLdTT for 3'RACE (MAT-2), were used as templates to amplify cDNAs by PCR using primers indicated by the small arrows. Each cDNA was generated by two sequential PCR reactions using primer pairs and annealing temperatures (°C) as follows: GLi1/GL4 (GLi1 and SKCM1-1, 52°; GLi1 and GL4, 58), GLi1/GL5 (GLi1 and SKCM2-1, 52; GLi1 and GL5, 58), SKCM1-2/SKCM1-1 (GLi1 and SKCM1-1, 55; SKCM1-2 and SKCM1-1, 55), SKCM2-2/SKCM2-1 (GLi1-SKCM2-1, 52; SKCM2-2 and SKCM2-1, 55), GL13/GL5 (G13 and GL14, 62; G13&GL5, 62), GL17/GL5 (G17 and GL14, 62; G17 and GL5, 62), 3¢RACE product GL36/GLdT (GL35 and GLdT, 55; GL36 and GLdT, 55) |
| Article in PDF format (540 KB) | Abstract Fig. 1 Fig. 2 Fig. 3 Fig. 4 Introns Fig. 5 Fig. 6 Fig. 7 Fig. 8 |
|
|
The Seed Biology Place
|
Webdesign Gerhard Leubner 2000
|