Plant Physiology 138: 1538-1551 (2005)
Water Uptake and Distribution in Germinating Tobacco Seeds Investigated in Vivo by Nuclear Magnetic Resonance Imaging [w]
Institut für Biologie II (Botanik/Pflanzenphysiologie), Albert-Ludwigs-Universität Freiburg, Schänzlestr. 1, D-79104 Freiburg i. Br., Germany, Web: 'The Seed Biology Place' http://www.seedbiology.de (K.M., B.K., G.L.-M.)
Received February 21, 2005; revised April 14, 2005; accepted Aprill 20, 2005; published June 24, 2005
Click on the image to download a larger image version
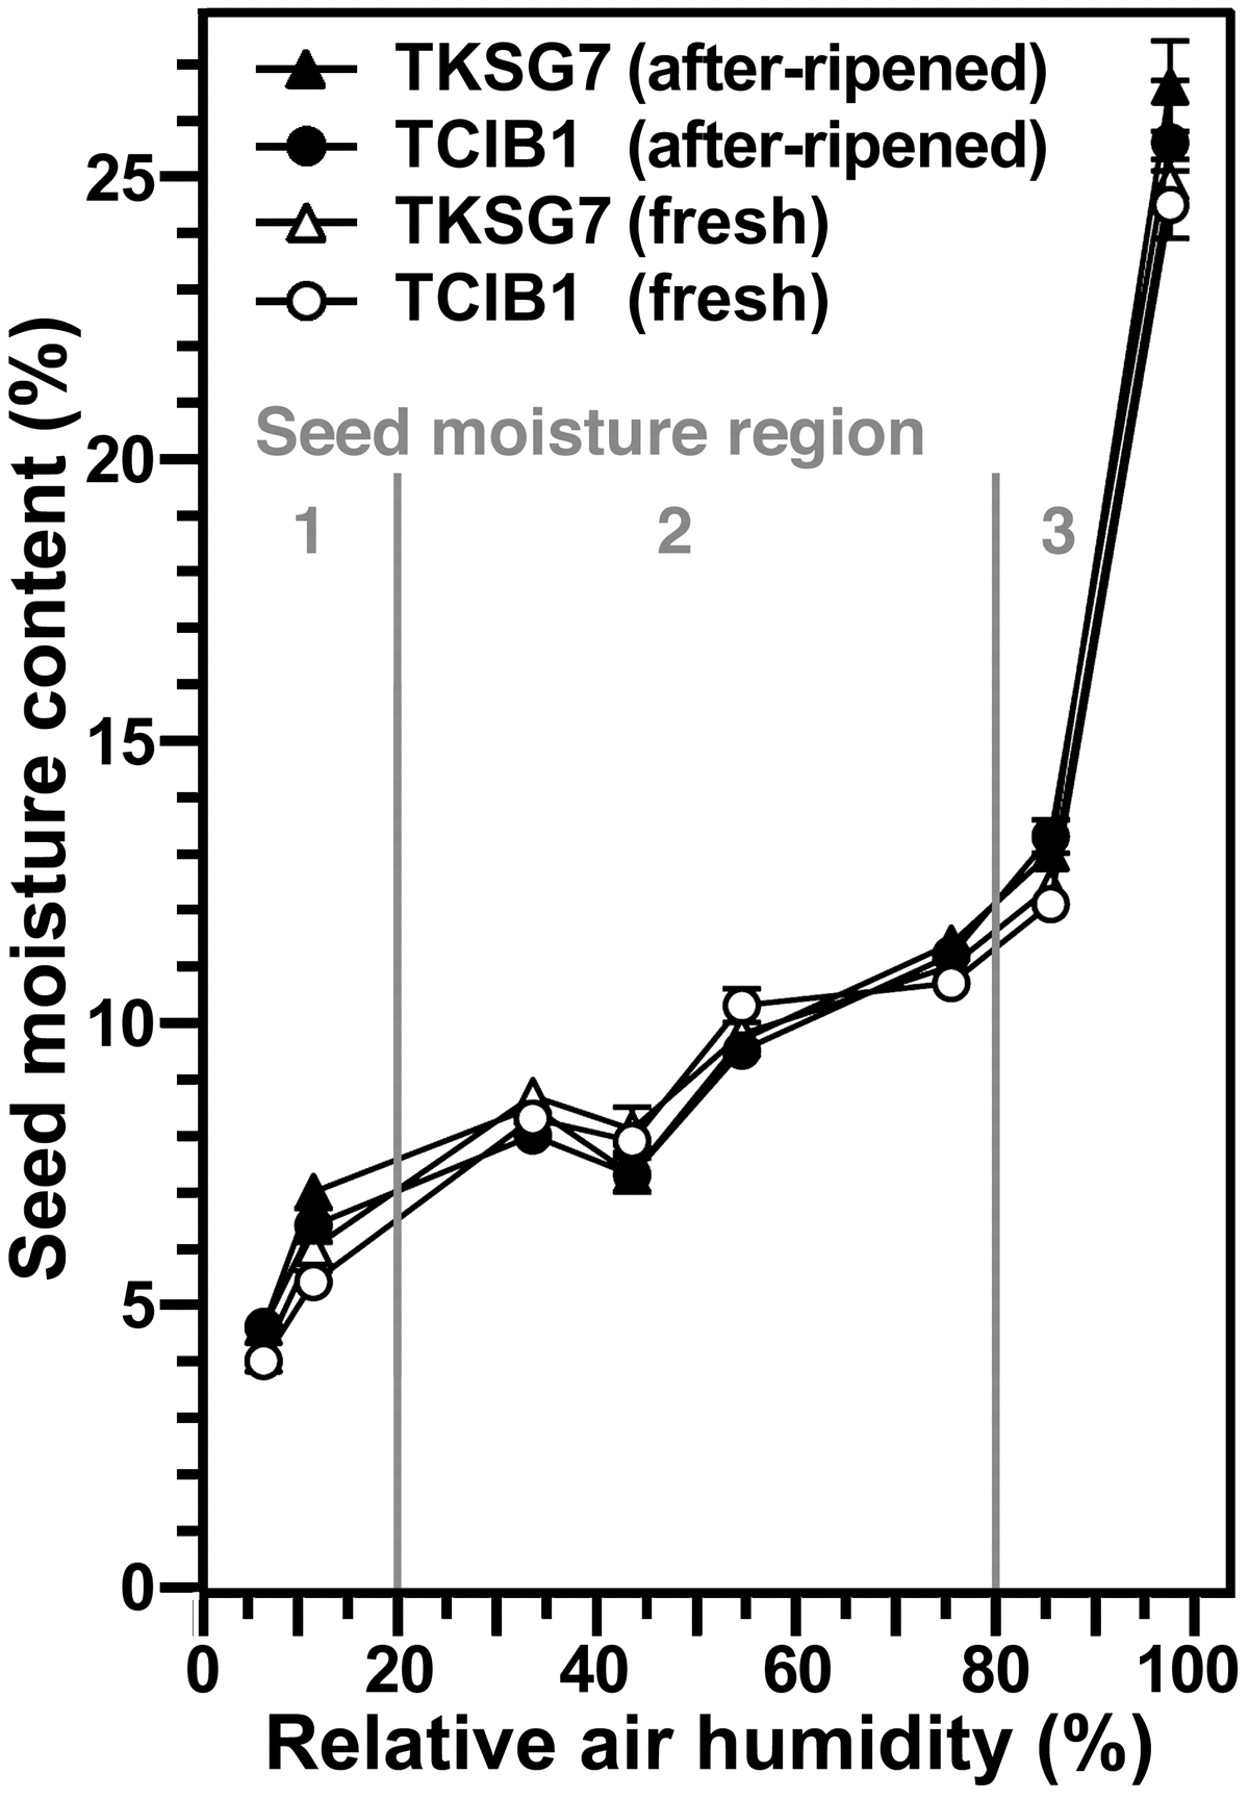
Figure 5. Moisture sorption isotherms of fresh and after-ripened TKSG7 and TCIB1 tobacco seeds. Seeds were incubated for 2 weeks at 24°C above defined saturated salt solutions (Winston and Bates, 1960). Saturated solutions of NaOH, LiCl, MgCl2, K2CO3, Mg(NO3)2, NaCl, KCl, and K2SO4 were used to generate 6%, 11%, 33%, 43%, 54%, 75%, 85%, and 97% relative air humidity, respectively. Seed moisture content is expressed as percentage (w/w) water per FW. Three regions of water availability (1, 2, and 3) can be distinguished and are described in the text. Note that the moisture sorption isotherm of wild-type tobacco seeds (data not shown) did not differ from the presented curves. Mean ±SE of at least five samples are presented for each time point. When error bars are not shown, the ± SE values are <0.5.
Click on the image to download a larger image version
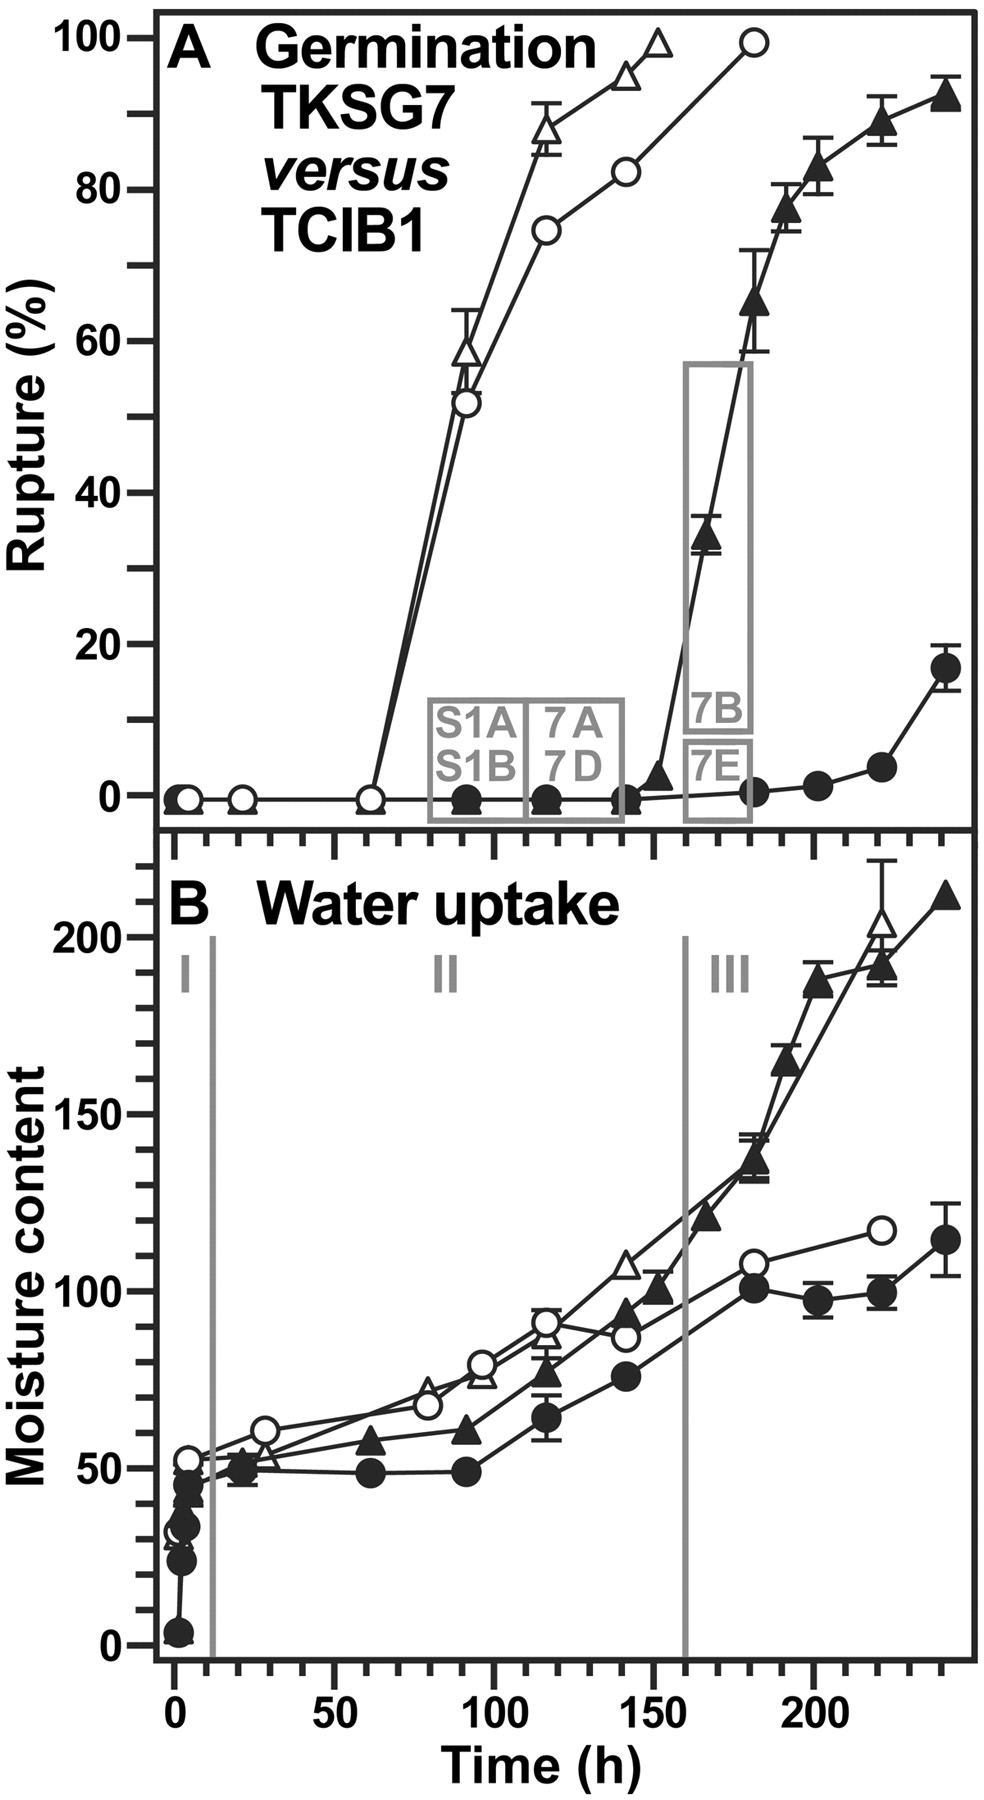
Figure 6. Time course analyses of the effect of ßGlu I overexpression on the water uptake during tobacco seed germination in medium with 10 µM ABA. TKSG7 (triangles ; ßGlu I overexpression in seed-covering layers) seeds were compared to TCIB1 (circles; empty-vector control, wild-type phenotype with regard to ßGlu I and germination) seeds. A, The incidence of testa rupture (white symbols) and endosperm rupture (black symbols). The gray boxes and their numbers correspond to the sections of Figure 7 and Supplemental Figure 1 (S1) showing in vivo NMR microimaging of seeds from these time windows. B, Water uptake measured gravimetrically (black symbols; micrograms water per seed) and by in vivo 1H-MAS NMR (white symbols; relative values). I, II, and III are the three phases of water uptake as described in the text. Mean ± SE of at least three samples are presented for each time point. When error bars are not shown, the ±SE values are <2 (A) or <1 (B).
| Article in PDF format (852 KB) |
|
|
|
The Seed Biology Place
|
Webdesign Gerhard Leubner 2000
|