Plant Physiology 138: 1538-1551 (2005)
Water Uptake and Distribution in Germinating Tobacco Seeds Investigated in Vivo by Nuclear Magnetic Resonance Imaging [w]
Institut für Biologie II (Botanik/Pflanzenphysiologie), Albert-Ludwigs-Universität Freiburg, Schänzlestr. 1, D-79104 Freiburg i. Br., Germany, Web: 'The Seed Biology Place' http://www.seedbiology.de (K.M., B.K., G.L.-M.)
Received February 21, 2005; revised April 14, 2005; accepted Aprill 20, 2005; published June 24, 2005
Click on the image to download a larger image version
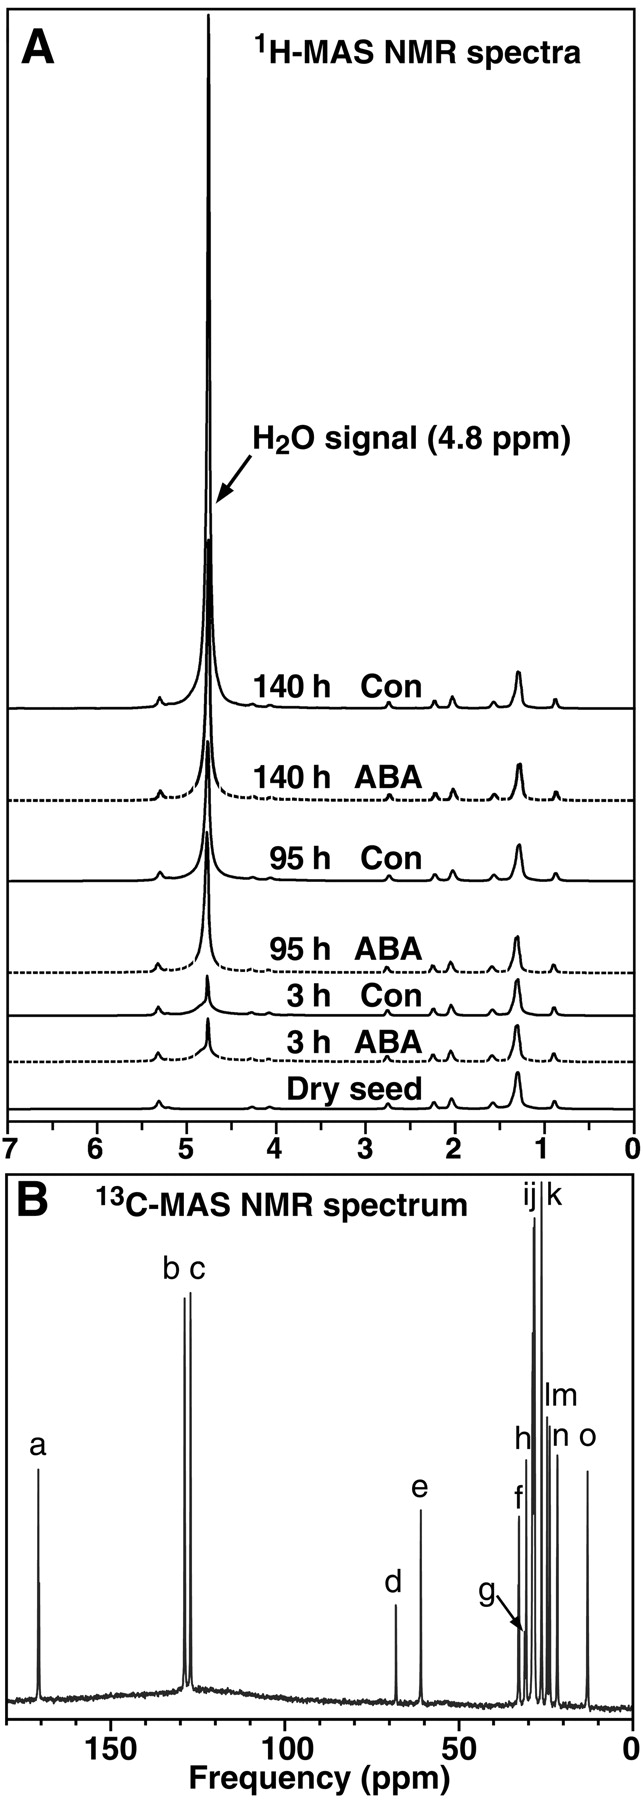
Figure 1. Representative in vivo 1H-MAS NMR (A) and 13C-MAS NMR (B) spectra of tobacco seeds. A, The area below the H2O signal at 4.8 ppm was used to calculate the relative water uptake of tobacco seeds with time after the start of imbibition in medium without (Con) and with (ABA) 10 µM ABA, which is presented in Figure 2B. B, The assignment of glycerol and fatty acid peaks according to Bardet et al. (2001). Glycerol (d and e), C18:19 + C18:2 (a, b, i, j, and m–o), C18:2 (c, h, and l), C18:19 (f and g). The relative contents per seed presented in Figure 2C were calculated from the corresponding peak heights.

Click on the image to download a larger image version
Figure 2. Time course analyses of water uptake and oil mobilization during wild-type tobacco seed germination. A, The incidence of testa rupture (diamonds) and endosperm rupture (circles) expressed as percent of approximately 100 seeds scored with time after the start of imbibition in medium without (Control, white symbols) and with (ABA, black symbols) 10 µM ABA. The gray boxes and their numbers correspond to the sections of Figures 3 and 4 showing in vivo NMR microimaging of seeds from these time windows. B, Water uptake measured gravimetrically (circles; micrograms water per seed) and by in vivo 1H-MAS NMR (triangles; relative values per seed); Control (white symbols), ABA (black symbols). I, II, and III are the three phases of water uptake as described in the text. C, Seed oil mobilization measured biochemically as triacylglycerides (TAG, circles; micrograms per seed) and by in vivo 13C-MAS NMR (linoleic acid, triangles; oleic acid, diamonds; relative contents per seed); Control (white symbols), ABA (black symbols). Mean ± SE of at least three samples are presented for each time point. When error bars are not shown, the ±SE values are <2 (A) or <1 (B and C).
| Article in PDF format (852 KB) |
|
|
|
The Seed Biology Place
|
Webdesign Gerhard Leubner 2000
|